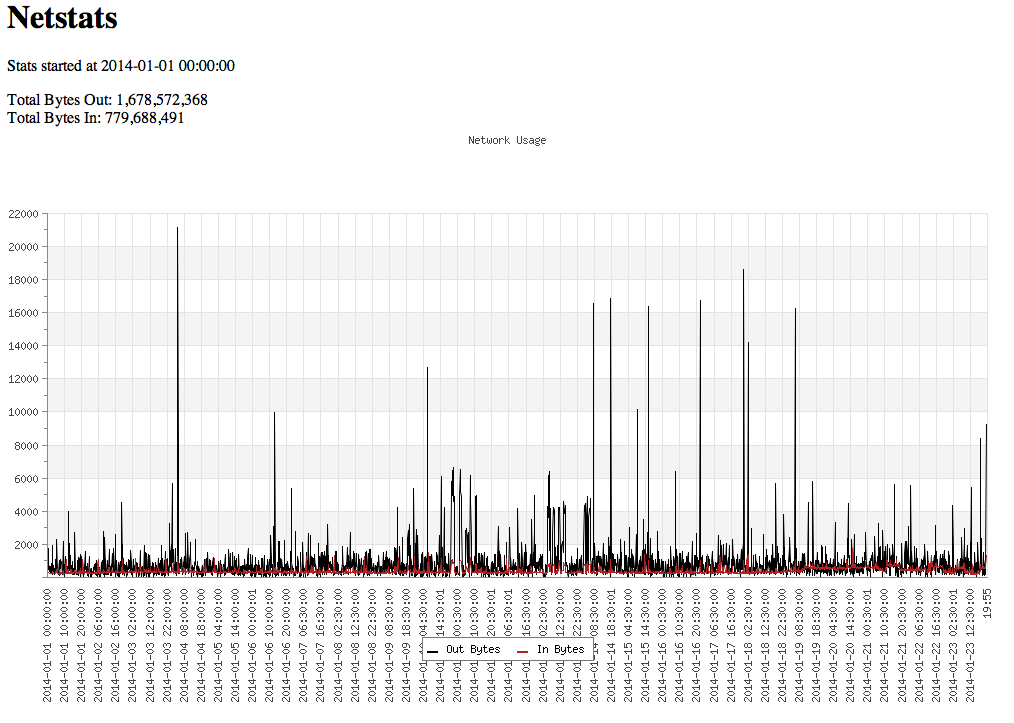
My free trial period of my Smart Machine ended, so now I was trying to find a way to monitor my bandwidth usage on my Smart machine. There isn’t a “easy” way of doing (like logging in to the portal to look at your account) so I devised a way to do it on my own.
The first part of it will be discussed in this post, and I will do another about how to actually view the results.
First off the easiest way I have found to “watch” network traffic is using the kstat command. On my SmartMachine, I have 2 network interfaces, one that has the public interface on it, and one that has the private interface on it. For my purposes I am only currently watching “net1” which is the external interface.
So the small script I have runs every 10 minutes, and logs the information in to a MySQL table. That table is defined like this:
CREATE TABLE `vmnet` (

`interface` char(10) DEFAULT NULL,

`time` bigint(20) DEFAULT NULL,

`obytes` bigint(20) DEFAULT NULL,

`rbytes` bigint(20) DEFAULT NULL,

`htime` datetime DEFAULT NULL,

KEY `tidx` (`time`)

) ENGINE=InnoDB DEFAULT CHARSET=utf8;
The columns are as follows:
- interface: which interface we are getting the stats from, right now everything just says net1. But if I were to add net0 it would fit right in.
- time: time in seconds since the epoch
- obytes: bytes leaving the interface
- rbytes: bytes received on the interface
- htime: human readable time. (Yes i realize I am storing the time twice, and that I can do everything with just time, but what the heck, it is just an extra little storage ;-)…
Now that the table in the DB is defined, set the permissions on it. In my case I created a database just for the “netstats” �and there is just the one table in it called vmnet. I created 2 users that have access to the vmnet table. One just for writing the data in from the script, and another for reading the data for part 2 of this.
Now for the script, it is pretty simplistic:
#!/bin/bash

#Use kstat to grab interface stats

#Define the interface to look at:

INTF="net1"

VALUES="`kstat -c net -n ${INTF} | egrep \"(obytes64|rbytes64)\"`"

SNAPTIME="`perl -e \"print(time());\"`"

OBYTES="`echo ${VALUES} | grep obytes64 | awk '{print $2}'`"

RBYTES="`echo ${VALUES} | grep rbytes64 | awk '{print $4}'`"

echo "insert into vmnet values ('${INTF}',${SNAPTIME},${OBYTES},${RBYTES},NOW());" | /opt/local/bin/mysql -uUUUUUU -pPPPPPPPPP netstats
In the most�simplest�form, the script runs the kstat command on the requested interface ${INTF} and then uses egrep to grab the obytes64 and rbytes64. It then takes those to values and creates a sql insert and piles that in to mysql command where UUUUUU is the username and PPPPPPPP is the password for the insert use on the netstats database.
I then run this every 10 minutes. And what you end up with is data in the table that looks like this:
+-----------+------------+------------+------------+---------------------+
| interface | time       | obytes     | rbytes     | htime               |
+-----------+------------+------------+------------+---------------------+
| net1      | 1388373702 | 3123241114 | 3977125001 | 2013-12-29 22:21:42 |
| net1      | 1388374200 | 3123381303 | 3977326242 | 2013-12-29 22:30:00 |
| net1      | 1388374457 | 3140146411 | 3977725426 | 2013-12-29 22:34:17 |
| net1      | 1388374800 | 3140170245 | 3977843340 | 2013-12-29 22:40:00 |
| net1      | 1388375400 | 3140526526 | 3978051264 | 2013-12-29 22:50:00 |
+-----------+------------+------------+------------+---------------------+
Next time I will show how to take the data and make something out of it:

