
Lately I have been doing a lot of learning about PostgreSQL and how it can be used to replace other databases, such as Oracle RDBMS, MySQL, etc. One of the things that I have been looking to most recently is how to make PostgreSQL highly available. In Oracle you would use RAC, however in PostgreSQL you have streaming replication, but that only leaves for a single master server and technically an unlimited number of slaves. In reality most web based applications these days are 90% read and about 10% write so having tons of slaves for read-only queries is awesome, but what if your master goes down?
That is where Patroni comes in. Patroni is a framework that handles the auto failover of the master instance of PostgreSQL between multiple servers. However Patroni alone won’t do this for you, you will need some other software as well. The other two pieces of software that I used was etcd and haproxy. etcd will be the quorum system and haproxy will be the “load balancer” so that your applications only have to have one hostname to point to.
As a small example setup, I used 3 machines running PostgreSQL 10, 1 machine running etcd and one machine running haproxy. What the rest of this post will be about is setting up the different machines and software on them.
How to setup Centos 7 + PostgreSQL 10 + Patroni
All Machines Software Installs:
The first thing to do is install CentOS 7, fully patch it and record the IP address of each machine if they are on DHCP. I used the minimal install so there wasn’t a lot of extra software on the machines.
PostgreSQL 10 Servers:
For all the PostgreSQL servers the following packages will need to be installed: gcc, python-devel, epel-release
yum install -y gcc python-devel epel-release
After you have those installed (in particular the epel-release one) you can install the following : python2-pip
yum install -y python2-pip
Next you need to add the PostgreSQL Yum Repo from: https://download.postgresql.org/pub/repos/yum/10/redhat/rhel-7-x86_64/pgdg-centos10-10-2.noarch.rpm
yum install -y https://download.postgresql.org/pub/repos/yum/10/redhat/rhel-7-x86_64/pgdg-centos10-10-2.noarch.rpm
Once you have that RPM installed you can install the following packages: postgresql10-server postgresql10
yum install -y postgresql10-server postgrseql10
etcd server:
The following packages needs to be installed on the etcd server: gcc,python-devel, epel-release
yum install -y gcc python-devel epel-release
After epel is installed, you can then install etcd:
yum install -y etcd
haproxy server:
The following packages are needed on the haproxy server: epel-release and then haproxy.
yum install -y epel-release
yum install -y haproxy
Software Configuration
Postgresql Servers
Now that the software has been installed, it is time to configure the components. (Everything here is ran as root)
We will start with the PostgreSQL Servers, mine are named pg01 (10.0.2.124), pg02 (10.0.2.125), and pg03(10.0.2.126) respectively. The following needs to be done on each of the 3 servers:
First some pip items:
pip install --upgrade setuptools
pip install patroni
pip install python-etcd
pip install psycopg2-binary
Next we are going to create a systemd service for patroni. So edit the file /etc/systemd/system/patroni.service to contain the following:
[Unit]
Description=Runners to orchestrate a high-availability PostgreSQL
After=syslog.target network.target

[Service]
Type=simple

User=postgres
Group=postgres

ExecStart=/bin/patroni /etc/patroni.yml

KillMode=process

TimeoutSec=30

Restart=no

[Install]
WantedBy=multi-user.targ
Next create a /etc/patroni.yml file. This file will control the startup/shutdown, etc of the postgres instance. Here is an example of mine from my pg01 server. In it, you will need to replace IP addresses for your own servers and usernames and passwords.
scope: postgres
name: pg01

restapi:
    listen: 10.0.2.124:8008
    connect_address: 10.0.2.124:8008

etcd:
    host: 10.0.2.128:2379

bootstrap:
    dcs:
        ttl: 30
        loop_wait: 10
        retry_timeout: 10
        maximum_lag_on_failover: 1048576
        postgresql:
            use_pg_rewind: true

    initdb:
    - encoding: UTF8
    - data-checksums

    pg_hba:
    - host replication replicator 127.0.0.1/32 md5
    - host replication replicator 10.0.2.124/0 md5
    - host replication replicator 10.0.2.125/0 md5
    - host replication replicator 10.0.2.126/0 md5
    - host all all 0.0.0.0/0 md5

    users:
        admin:
            password: admin
            options:
                - createrole
                - createdb

postgresql:
    listen: 10.0.2.124:5432
    bin_dir: /usr/pgsql-10/bin
    connect_address: 10.0.2.124:5432
    data_dir: /data/patroni
    pgpass: /tmp/pgpass
    authentication:
        replication:
            username: replicator
            password: PASSWORD
        superuser:
            username: postgres
            password: PASSWORD
    parameters:
        unix_socket_directories: '.'

tags:
    nofailover: false
    noloadbalance: false
    clonefrom: false
    nosync: false
etcd server
Now lets move on to the etcd server. The only thing on the etcd server that needs edited is the /etc/etcd/etcd.conf file. Here is what I changed in mine:
ETCD_LISTEN_PEER_URLS="http://10.0.2.128:2380"
ETCD_LISTEN_CLIENT_URLS="http://localhost:2379,http://10.0.2.128:2379"
ETCD_NAME="etcd0"
ETCD_INITIAL_ADVERTISE_PEER_URLS="http://10.0.2.128:2380"
ETCD_ADVERTISE_CLIENT_URLS="http://10.0.2.128:2379"
ETCD_INITIAL_CLUSTER="etcd0=http://10.0.2.128:2380"
ETCD_INITIAL_CLUSTER_TOKEN="cluster1"
ETCD_INITIAL_CLUSTER_STATE="new"
Some of the above lines may be commented out, if so uncomment them and replace the values.
HAProxy Server
Now to config the HAProxy Server. Replace the /etc/haproxy/haproxy.cfg with the following:
global
        maxconn 100
        log     127.0.0.1 local2

defaults
        log global
        mode tcp
        retries 2
        timeout client 30m
        timeout connect 4s
        timeout server 30m
        timeout check 5s

listen stats
        mode http
        bind *:7000
        stats enable
        stats uri /

listen postgres
        bind *:5000
        option httpchk
        http-check expect status 200
        default-server inter 3s fall 3 rise 2 on-marked-down shutdown-sessions
        server postgresql_pg01_5432 10.0.2.124:5432 maxconn 100 check port 8008
        server postgresql_pg02_5432 10.0.2.125:5432 maxconn 100 check port 8008
        server postgresql_pg03_5432 10.0.2.126:5432 maxconn 100 check port 8008
N.B. The logging setup in the haproxy config requires that you set up rsyslog to allow logging to local files and to local2.*
Starting it all up
So assuming that I haven’t missed anything above, and there are no typo’s on my or your part, we can start starting things up. But first some notes. Something in SElinux breaks some of this and I haven’t had enough time to look in to it, so disable SElinux for now (setenforce 0). In addition I did not add any ports to the firewalld, as this was just a test setup, so I disabled the firewall on all 5 machines. You can leave it enabled and then using the configs above add the appropriate ports to be allowed between the appropriate machines.
So easy starts first:
Start the etcd server:
systemctl start etcd
Start the haproxy server:
systemctl start haproxy
Now for the PostgreSQL servers there are a few things to do before we start them. On each PostgreSQL host do the following:
mkdir -p /data/patroni
chown -R postgres:postgres /data
chmod -R 700 /data
Now we can start Patroni and see if everything works. When you start Patroni, it will start PostgreSQL in the background and create the first database and set the username and password for the postgres user to what you specify in the /etc/patroni.yml file.
systemctl start patroni
On the first host that you start Patroni on if you run systemctl status patroni you should see that it is running and active. In the /var/log/messages you should see something like :
Sep 2 19:53:08 pg01 patroni: 2018-09-02 19:53:08,628 INFO: Lock owner: pg01; I am pg01
Sep 2 19:53:08 pg01 patroni: 2018-09-02 19:53:08,636 INFO: no action. i am the leader with the lock
When you start the two slaves you should see something similar to this in the /var/log/messages:
Sep 2 19:54:17 pg02 patroni: 2018-09-02 19:54:17,828 INFO: Lock owner: pg01; I am pg02
Sep 2 19:54:17 pg02 patroni: 2018-09-02 19:54:17,829 INFO: does not have lock
Sep 2 19:54:17 pg02 patroni: 2018-09-02 19:54:17,836 INFO: no action. i am a secondary and i am following a leader
Now if you switch to the web interface of HAProxy you should see something like this:
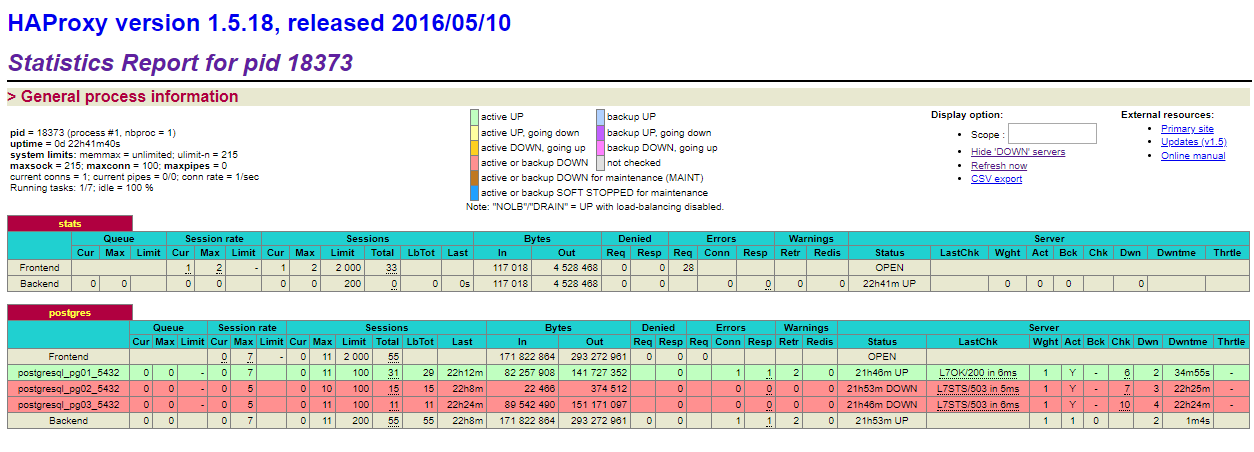
What this image shows is that the pg01 server is the active master server. If you were to shut down pg01, then one of the other two will become the new master and remain the master until you either promote another server or the new master goes down.
Now that everything is running, you would point your clients to the haproxy address on port 5000.
Closing Comments
While this describes how to setup an HA Environment for PostgreSQL, there are 2 single points of failure with this example setup. One is the etcd server, which should be clustered, the other is the haproxy which should be clustered as well. In addition I didn’t cover setting up read-only slaves which I may do at some point in the future.